
Microsoft Fabric & Data Lake
Connect. Transform. Unify.
One governed source of truth, refreshed on a schedule your business sets.
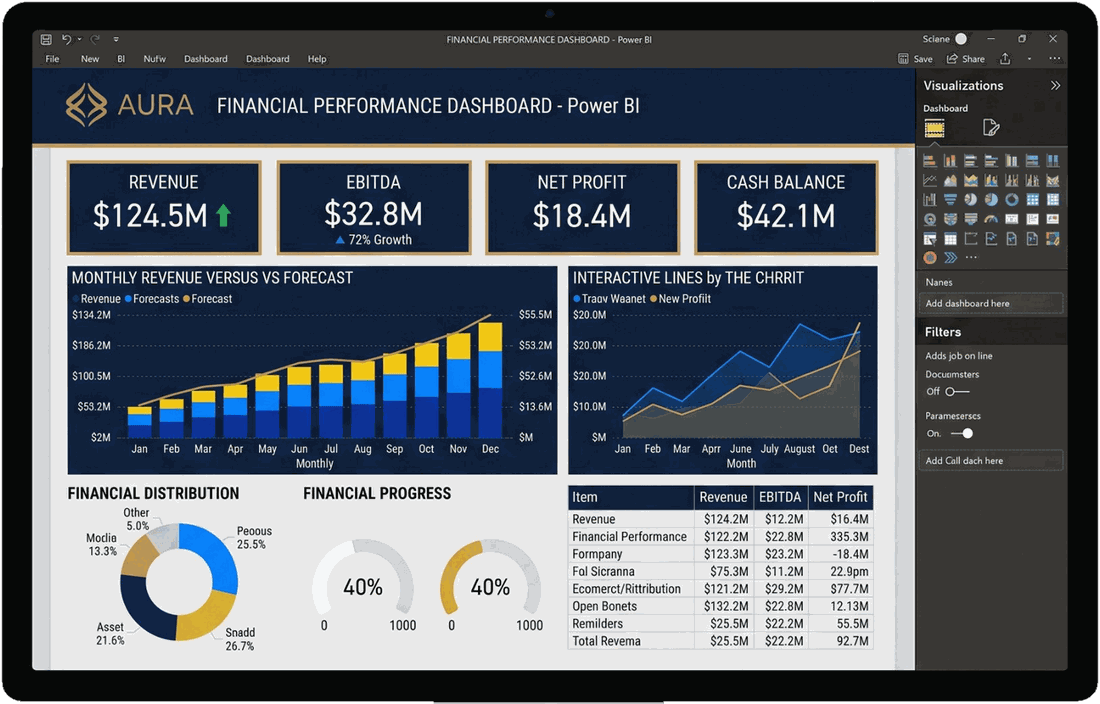
Interactive Dashboards
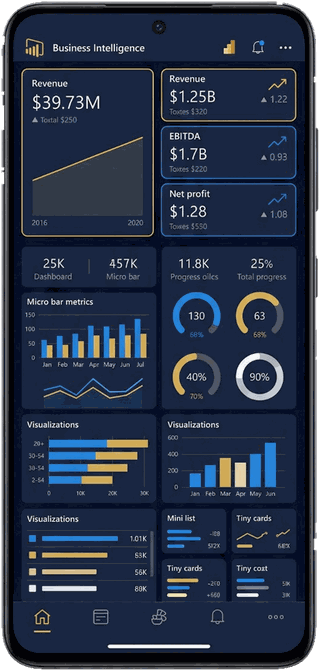
Insight, on any device
Executive, finance and operational views — from overview to transaction detail.
NOTHING IS LEFT OUT BECAUSE IT LIVES IN THE WRONG SYSTEM
Ledger, AP, AR and the general ledger itself.
Pipeline, customers and won business.
Budgets, forecasts and management accounts.
Volumes, utilisation and operational KPIs.
Headcount, cost of people and movement.
Spend, suppliers and commitments.
The spreadsheets the business still runs on.
Anything else with an API worth reading.
ONE MODEL · SEVEN AUDIENCES
Revenue, EBITDA, net profit and cash on one screen.
Margin, cost structure and variance to budget.
Operational performance against plan.
Revenue by business unit, region and top customers.
Spend and supplier concentration.
Headcount trend and people cost.
Delivery, cost to complete and exposure.
Numbers that are current, not last month’s.
Every entity and division in one place.
Built for the board, not for analysts.
Desk, laptop or phone — the same view.
Headline figure to source transaction in a click.
All your data. One platform. Clear insights. Better decisions.
WHERE THIS SITS IN OUR CAPABILITIES
OFTEN RUNS ALONGSIDE

ONE PLATFORM · CLEAR INSIGHTS · BETTER DECISIONS
DISCUSS | EXPLORE | PLAN | GROW